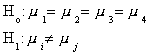
Analysis of Variance
The basic idea is to compare alternative estimates of the population variance for the
purpose of deciding whether the groups have differnet means. The alternative estimates are
predicated on the notion that the mean for certain groups within the population is the
same. Under that working supposition there should be no difference in variance estimates
constructed from the different sample groups corresponding to the grouping in the
population.
One Factor Analysis of Variance
Suppose we have four heads of household, each with a different type of education
regarding the effects of alcohol consumption. Their educational program can be regarded as
the treatment. For each of them we record their weekly consumption of distilled spirits
for each of three weeks. Is their weekly consumption the same? Formally,
We can formulate the problem in one of two alternative ways:
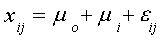
i=1,2,3 and j=1,2,3
where i denotes the particular head of household and j denotes the week. In this
formulation three heads of household are measured against an arbitrary base person.
An alternative formulation is:
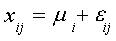
i=1,2,3,4 and j=1,2,3
Now each household is measured absolutely.
We have the following data:
|
Week |
| Household |
1 |
2 |
3 |
 |
| x1 |
13 |
8 |
9 |
10 |
| x2 |
15 |
11 |
13 |
13 |
| x3 |
8 |
12 |
7 |
9 |
| x4 |
11 |
15 |
10 |
12 |
 denotes the three week mean for the ith head of
household for m=4 households.
denotes the three week mean for the ith head of
household for m=4 households.
The grand mean is  = 11.
= 11.
The sample sizes are n1=n2=n3=n4=3, and n= .
.
With respect to the two alternative linear models, the entries in the body of the table
are observations on the dependent variable.
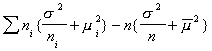
If all four households have a common mean, then we could pool the data in the computation
of the sample variance as an estimate of the population variance. That is, we could
compute the total sum of squares as
SS(TOT)=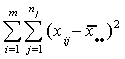 (1)
(1)
But each household may have a different mean, so using (1) would be in error. Accounting
for the differences between households, groups, we would use
SS(E)=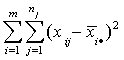 (2)
(2)
In (2) we compute the sum of squares within a group or treatment, then add them up. This
is referred to as the error sum of squares. It is large if there is a lot of variation
within the group.
We could also see if there is variation between the groups:
SS(B)=
This would be large if there is variation between the groups. That is, there are large
differences between the group means and the grand mean.
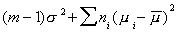
Things to note:
1. Each of the sums of squares is 2 if the variable x is normal with finite
mean and variance.
2. Regardless of whether or not the null is true, we know that 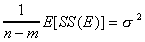 , but SS(B) is an unbiased estimator of the population variance only if
the group means are equal:
, but SS(B) is an unbiased estimator of the population variance only if
the group means are equal:
Proof:
E[SS(B)]=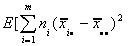
=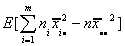
Adding and subtracting some terms, we can write this as E[SS(B)]=

= 
= 
= 
This observation suggests the test statistic
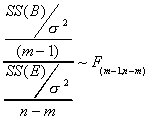
m-1 is the number of unique restrictions necessary to impose equality of means across all
groups. In the denominator there are n terms in the sum, but we have used the data m times
to compute different group means.
For our example:
SS(TOT)=80, SS(E)=50, SS(B)=30
F=
Ho is not rejected.
This sort of analysis of variance is often summarized in a table. Almost every computer
package has some variant of this general presentation.
| Source |
Sum of
Squares |
Degrees of
Freedom |
| Treatment |
SS(B) |
m-1 |
| Error |
SS(E) |
n-m |
| Total |
SS(TOT) |
n-1 |
To return to our presentation of the problem as a linear model:
Formulation 1:
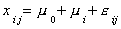
With our data and a bit of linear algebra we can write this as:
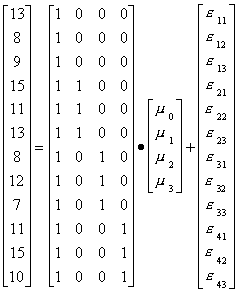
Now we can use a regression package to estimate the parameters. The intercept, or mean for
household 1 is  . That
for household 2 is
. That
for household 2 is  .
For three it is
.
For three it is and
for the last household it is
and
for the last household it is  . The output for this regression looks like
| Mean of x |
11.0 |
No. of Obs. |
12 |
| R2 |
.375 |
Std. Dev. Of x |
2.6968 |
| F(3,8) |
1.6 |
P(F>1.6) |
.26 |
| Variable |
Coefficient |
t-ratio |
| Constant |
10.0 |
6.92 |
| D1 |
3.0 |
1.47 |
| D2 |
-1.0 |
-.49 |
| D3 |
2.0 |
.98 |
Note:
- The t-statistics for the coefficients on D1, D2, D3 are not different from zero. That
is, none of the group means differ from the mean of the first group.
- The SS(E)= 50.
- The F-statistic in the table is 1.6; the same as our previous answer.
Formulation 2:

With our data and a bit of linear algebra we can write this as:
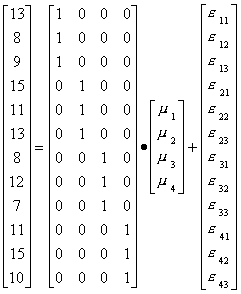
And gotten the regression output:
| Variable |
Coefficient |
t-ratio |
| D1 |
10.0 |
6.928 |
| D2 |
13.0 |
9.007 |
| D3 |
9.0 |
6.235 |
| D4 |
12.0 |
8.314 |
Note:
- The top part of the table has not been presented because the information does not
change.
- Now the t-statistics are different from zero. Each of the group means is different from
zero, but we don't know if they differ from one another.
- The F-statistic is again 1.6.
If we fit a linear model with the assumption that the means are equal across groups we
get
Variable
|
Coefficient
|
t-ratio
|
Constant
|
11.0
|
14.130
|
Two Factor Analysis
Suppose that we have four ways of teaching and three different instructors. For the
sake of argument, suppose that the standardized test score by class size and teacher is
given by:
|
Teaching method |
| Instructor |
Lecture |
Discussion |
Computer |
Video |
 |
| 1 |
16 |
18 |
21 |
21 |
19 |
| 2 |
14 |
15 |
18 |
17 |
16 |
| 3 |
15 |
15 |
18 |
16 |
16 |
 |
15 |
16 |
19 |
18 |
 |
Now we believe that the mean test score is affected by instructional method and specific
instructor. We could write this as a linear model:
where i is the row effect and j is the column effect. Each
instructor and method pair is measured relative to the base instructor 1 and lecture
method. With this in mind, we have 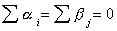 , and in the
table xij is the mean test score in equal size classes for i=1,2,…,a rows
and j=1,2,…,b columns.
, and in the
table xij is the mean test score in equal size classes for i=1,2,…,a rows
and j=1,2,…,b columns.
The regression results are
| Mean of dependent variable |
17 |
Std. Dev. Of Dependent Var |
2.296 |
| R2 |
.93 |
SS(E) |
4.0 |
| F(5,6) |
16.20 |
Pr(F>16.2) |
.002 |
| Variable |
Coefficient |
t-ratio |
| Constant |
17.00 |
29.445 |
| A2 |
-3.00 |
-5.196 |
| A3 |
-3.00 |
-5.196 |
| B2 |
1.00 |
1.500 |
| B3 |
4.00 |
6.000 |
| B4 |
3.00 |
4.500 |
where B2: discussion, B3: computer, B4: video and the Aj represent the second and third
instructors. The F-statistic indicates that the coefficients are not all zero. In fact,
judging from the t-ratios, only the coefficient on B2 is statistically no different from
zero.
In general, when there are 'a' rows and 'b' columns, we have
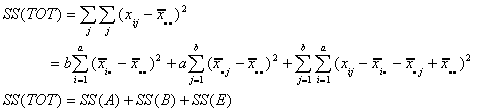
So we revise our ANOVA table as
| Source |
Sum of Squares |
Deg of Freedom |
| Row Effect |
SS(A) |
a-1 |
| Column Effect |
SS(B) |
b-1 |
| Error |
SS(E) |
(a-1)(b-1) |
| Total |
SS(TOT) |
ab-1 |
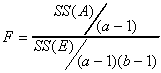
To test the row effect
To test the column effect
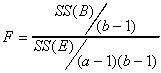
For the example
| Source |
SS |
df |
Mean Sq |
F |
| Row |
24 |
2 |
12 |
18 |
| Column |
30 |
3 |
10 |
15 |
| Error |
4 |
6 |
2/3 |
|
| Total |
58 |
11 |
|
|